简介
本文介绍如何通过python将csv文件数据简单地可视化。
使用到的文件
代码
import csv
import math
import numpy as np
import sys, os
from matplotlib import pyplot

listage = []
listnum = []

with open('generation.csv', 'r', encoding='utf-8') as f:
    reader = csv.reader(f)
    header = next(reader)

    for row in reader:
        listage.append(row[0])
        listnum.append(row[13])

x = listage
y = listnum

pyplot.plot(x, y,)
pyplot.xticks([1960, 1970, 1980, 1990, 2000, 2010], ["1960", "1970", "1980", "1990", "2000", "2010"])
pyplot.xlabel("Year")
pyplot.show()
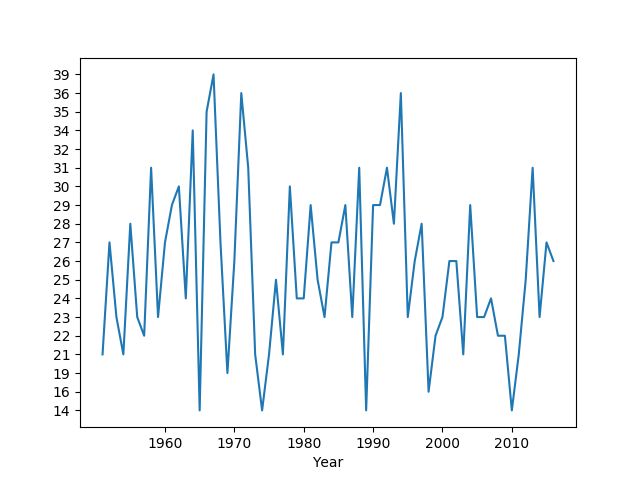
运行结果