
简介
本文主要介绍如何利用d3.js绘制中国地图
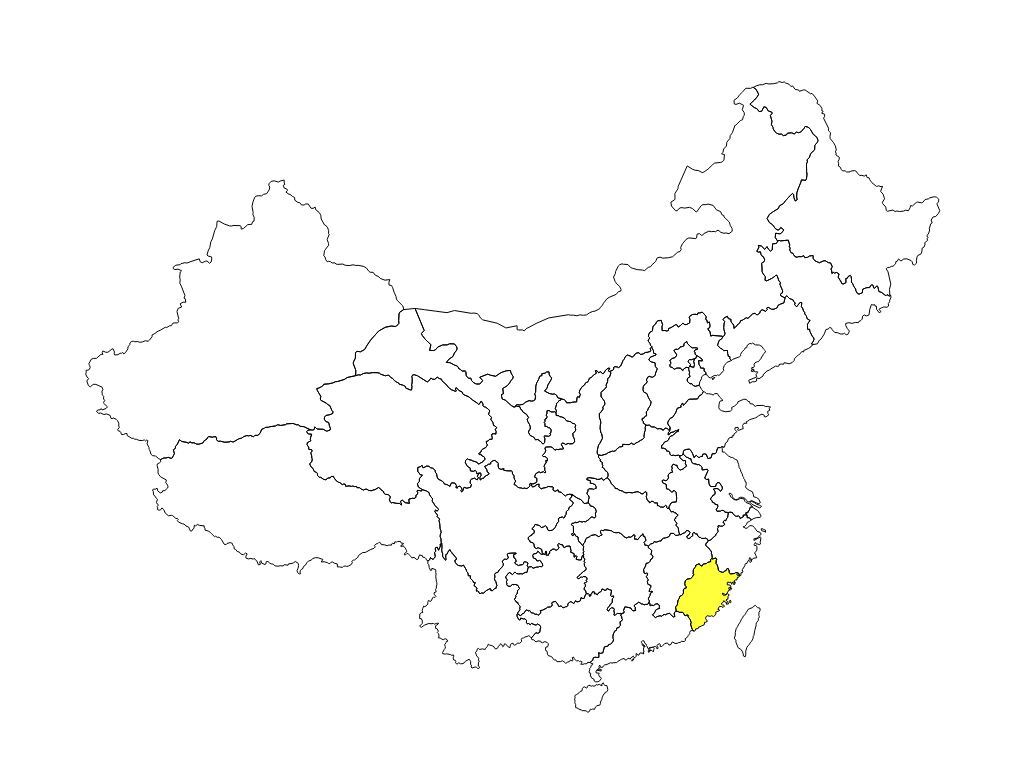
效果图
用到的数据
代码
引用相关依赖
    <script src="https://d3js.org/d3.v4.min.js"></script>
    <script src="https://d3js.org/topojson.v2.min.js"></script>
html部分
<svg width="1920" height="1080" fill="none" stroke-linejoin="round" stroke-linecap="round"></svg>
程序主体部分
    var svg = d3.select("svg");

    var projection = d3.geoMercator()
        .center([107, 31])
        .scale(800)
        .translate([svg.style('width').replace("px", "") / 2, svg.style('height').replace("px", "") / 2]);

    var path = d3.geoPath()
        .projection(projection);

    d3.json("./china.geojson", function (error, root) {

        if (error)
            return console.error(error);
//        console.log(root.features);

        svg.selectAll("path")
            .data(root.features)
            .enter()
            .append("path")
            .attr("stroke", "#000")
            .attr("stroke-width", 1)
            .attr("fill", function (d, i) {
                return d3.color(i);
            })
            .attr("d", path)   //纹路生成
            .on("mouseover", function (d, i) {
                d3.select(this)
                    .attr("fill", "yellow");
            })
            .on("mouseout", function (d, i) {
                d3.select(this)
                    .attr("fill", d3.color(i));
            });
    });
本文相关代码
https://github.com/cangyan/TAV/tree/master/00019_D3_CHINA_MAP